Portfolio Analysis Report
IACC Autism Spectrum Disorder Research
2011 - 2012
To better understand what areas of research were funded in 2011 and 2012, projects were aligned with the corresponding questions in the 2011 IACC Strategic Plan. Figures 8 and 9 illustrate the breakdown of the research funding according to the Strategic Plan’s seven questions related to Screening and Diagnosis, Biology, Risk Factors, Treatments and Interventions, Services, Lifespan Issues, and Infrastructure and Surveillance. Identifying how current research investments correspond to the Strategic Plan provides an understanding of how funders have directed investments across each of the priority areas identified by the IACC, as well as an indication of which areas are well supported versus those that may be in need of additional attention or development.
2011 ASD Research Funding by IACC Strategic Plan Question – All Funders
Total Funding: $299,879,145
Number of Projects: 1,227
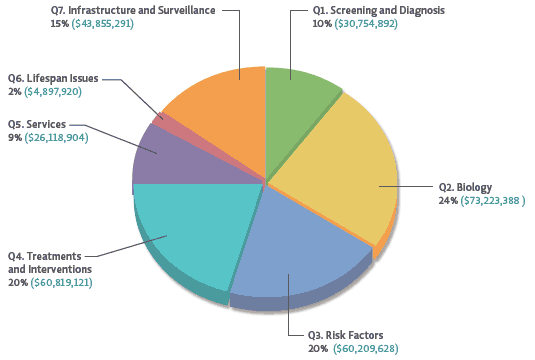
Figure 8. Topic areas are defined by each question in the IACC Strategic Plan. The seven questions of the Strategic Plan are represented in the clockwise direction, beginning with Screening and Diagnosis (Question 1) and ending with Infrastructure and Surveillance (Question 7).
2012 ASD Research Funding by IACC Strategic Plan Question – All Funders
Total Funding: $331,949,933
Number of Projects: 1,312
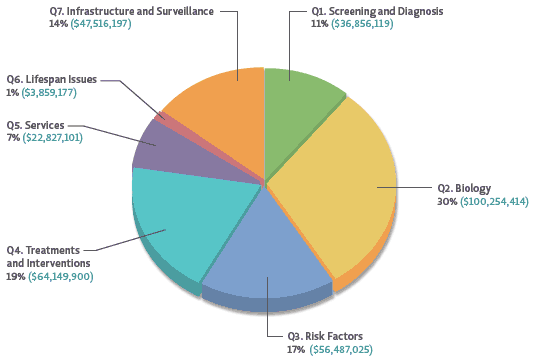
Figure 9. Topic areas are defined by each question in the IACC Strategic Plan. The seven questions of the Strategic Plan are represented in the clockwise direction, beginning with Screening and Diagnosis (Question 1) and ending with Infrastructure and Surveillance (Question 7). Due to rounding, the percentages do not equal 100%.
ASD research funding in 2011 and 2012 supported projects relevant to all seven of the critical questions in the IACC Strategic Plan for ASD Research, and the distribution across the seven questions was similar in both years. As in previous years, the largest portion of funding addressed the underlying biology (Question 2) of ASD (24%, 2011; 30%, 2012). This was followed closely by research aimed at identifying potential causes and risk factors (Question 3) for the disorder (20%, 2011; 17%, 2012). Funding of research into treatments and interventions (Question 4) for ASD, including behavioral therapy, pharmacological treatments, and technology-based interventions, increased from 2010 levels (17%, 20%, and 19% in 2010, 2011, and 2012 respectively). Investment in research infrastructure and surveillance (Question 7) also increased from 2010 levels (12%, 15%, and 14% in 2010, 2011, and 2012 respectively). This investment includes funding for data repositories such as the National Database for Autism Research (NDAR) and the Autism Genetics Resource Exchange (AGRE), as well as surveillance, including studies of ASD prevalence conducted by the Centers for Disease Control and Prevention (CDC).
By comparison, funding of research aimed at improving screening and diagnosis (Question 1) of ASD remained similar to previous years (11%, 10%, and 11% in 2010, 2011, and 2012 respectively). Investment in services research reported in 2011 and 2012 was 9% and 7%, respectively. These figures represent a decrease from the investment reported in 2010 (16% of the overall portfolio), but much of the change can be attributed to the prorated adjustments made in reporting in service-related funding. This proration resulted in a lower level of funding reported for services-related Strategic Plan questions (Questions 5 and 6) in 2011 and 2012 compared to previous years. Funding of research specifically centered on lifespan issues (Question 6) remains the smallest area of investment (2% and 1% in 2011 and 2012 respectively).
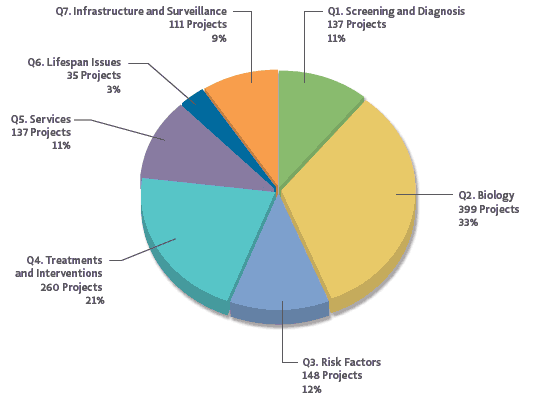
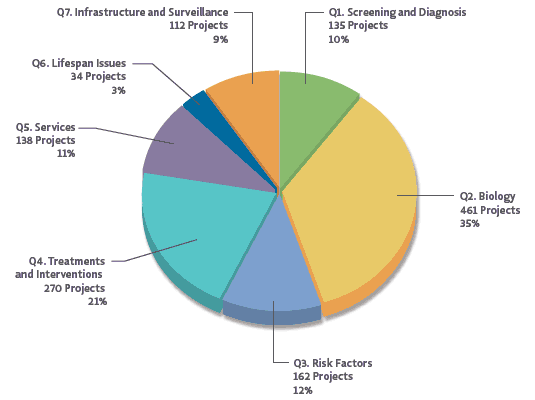
When the number of active projects that align with each question, as opposed to the total funding for these projects is considered, the distribution is subtly different due to differences in the relative sizes of projects falling under each of the seven question categories. In 2011, the percentage of total projects aligned with each question were as follows: Question 1 (11%), Question 2 (33%), Question 3 (12%), Question 4 (21%), Question 5 (11%), Question 6 (3%), and Question 7 (9%; See Figure 10). In 2012, the percentage of active projects aligned with each question were as follows: Question 1 (10%), Question 2 (35%), Question 3 (12%), Question 4 (21%), Question 5 (11%), Question 6 (3%), and Question 7 (9%; See Figure 11). It is interesting to note that the number of projects aligning with Question 5 and Question 6 is considerably greater than you might expect based on the proportion of overall funding aligning with these questions (this is also true to a lesser extent for Question 2). This indicates that in order to get a more comprehensive picture of the level of activity in each Strategic Plan question area, it may be helpful to consider both funding as well as number of projects. In contrast, there are fewer projects aligning with Question 3 and Question 7 than you might expect based on the portion of overall ASD research funding included in the Portfolio Analysis. This indicates that the size of the awards for infrastructure development projects (Question 7) and projects related to investigation of ASD risk factors (Question 3) tend to be larger, reflecting the greater cost involved in conducting research in these areas. Research into risk factors often involves large scale genetic and epidemiology studies, which can be costly. Similarly, funding of research infrastructure development and maintenance, such as databases, biobanks, and clinical centers is a considerable investment, but the results benefit multiple research projects.
Figure 10. 2011 Projects aligned to Strategic Plan questions.
Figure 11. 2012 Projects aligned to Strategic Plan questions. Due to rounding, the percentages do not equal 100%.


