Portfolio Analysis Report
IACC Autism Spectrum Disorder Research
2010
Within the seven questions that serve as the framework for the IACC Strategic Plan, each question has several specific short- and long-term objectives. The objectives in the Strategic Plan call for specific research efforts with a goal date for completion and include an estimate of the budget required to accomplish the goal.1 Each ASD project that received funding in 2010 was evaluated to determine which question and objective it fulfilled. This enabled assessment of progress corresponding to the Strategic Plan and identification of gaps in funded research.
In total, there are 78 objectives in the 2011 IACC Strategic Plan, including 16 newly added objectives addressing a range of research areas such as bioinformatic approaches to address environmental risk factors for ASD, studies of the microbiome, the role of epigenetics, microarray testing for genetic risk factors, studies focusing on interventions for nonverbal individuals with autism, safety issues, dental health issues, health promotion, ethical implications of research, and objectives to promote more data infrastructure and to enhance networks of clinical care. Based on the 2010 funding data, significant progress has been made toward fulfilling the objectives in the 2011 Strategic Plan, with at least some progress on 83% of the objectives. Only 13 of the objectives do not have any projects or funding directed to those particular research areas.
The following sections will give an overview of the progress on fulfilling objectives in each question of the Strategic Plan. The overall progress for each question will be denoted by a stoplight figure, with the number of objectives that are fully or partially fulfilled indicated in the green or yellow light (respectively), and the number of objectives where no progress has been made indicated in the red light. Within each question (1 to 7), the objectives are set apart by designating them as short- or long-term (with an "S" or an "L"), followed by sequential letters of the alphabet (e.g., 2.S.A, 2.S.B, 2.L.A, 2.L.B). For clarity of discussion, these shorthand abbreviations will be used in this analysis. For example, the first short-term objective in Question 1 is referred to as 1.S.A. Full titles and funding information for each objective, as well as the progress designated by the green, yellow, or red coding, can be found in Appendix A.
While attempts were made to assign all projects in the Portfolio Analysis to a specific objective, some projects could only be assigned at the Question level. This may be because they lacked particular aspects of research design required by the objective or because that type of research was not identified as a gap area in the Strategic Plan. In 2010, every question of the Strategic Plan included projects that were not specific to a particular objective (Figure 4). In particular, Question 2 (Biology) has a significant proportion of projects (60%) that are not specific to any Strategic Plan research objectives. The subcategory classification system, new to the 2010 Portfolio Analysis, was developed to help the IACC and other readers of this report to understand what types of research are encompassed by projects that do not fall into particular research objectives within the Strategic Plan.
2010 ASD Funding: Alignment with IACC Strategic Plan Objectives
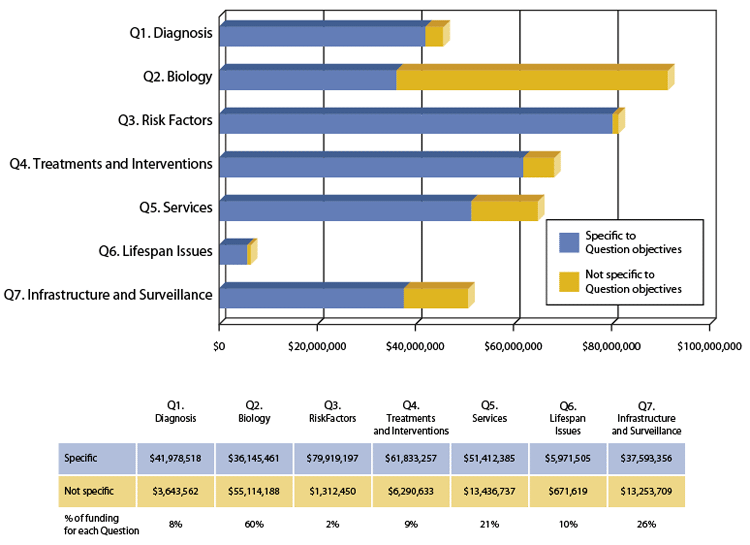
Figure 4. Each question in the Strategic Plan contained projects that were not specific to a particular objective. Funding for projects that fall under specific objectives are indicated in blue and projects that are not specific to objectives within a question are indicated in yellow. In 2010, the questions with the most projects that were not specific to their respective objectives were Question 2 (60%), Question 7 (26%), and Question 5 (21%). Questions 1, 4, and 6 all had similar proportions of funding for projects not specific to objectives (8%, 9%, and 10%, respectively). Question 3 had the smallest proportion of projects not specific to objectives, with just 2%. Subcategory analysis provided within the summary for each question of the Strategic Plan provides description of the topic areas addressed by all projects, including those that are not specific to IACC Strategic Plan objectives.
The subcategory analysis assesses the autism research projects based on the types of research conducted in each question of the Strategic Plan (Diagnosis, Biology, Risk Factors, Treatments and Interventions, Services, Lifespan Issues, Infrastructure and Surveillance). While some of the projects in the Portfolio Analysis do not fall within the specifications of a particular objective, the subcategories facilitate a comprehensive description of all of the research within a particular question.
For this analysis, subcategories were generated for each Strategic Plan question to provide a more comprehensive and detailed categorization of the research. Each project in the 2010 Portfolio Analysis data was then assigned to a subcategory based on the research area it addressed. For example, within Question 1 (Diagnosis), the projects were divided into four subcategories: Diagnostic and screening tools, Early signs and biomarkers, Intermediate phenotypes/Subgroups, and Symptomology. Projects were assigned to the one subcategory that corresponded best to the research aims. In addition to describing autism research, this categorization system also captured the types of research that did not fall within specific objectives of the Strategic Plan. A complete list of the subcategories used for each question can be found in Appendix B, along with descriptions of the types of research in each classification.
Question 1: Diagnosis

Projects assigned to Question 1 ("When Should I Be Concerned?") of the Strategic Plan comprised eleven percent ($45.6 million) of 2010 total ASD funding. Progress on the nine objectives in Question 1 is indicated by the stoplight figure to the right. In 2010, six objectives fulfilled their recommended budget amount (green light), while no progress was made on three objectives (red light). As in 2009, the two objectives receiving the most funding included developing measures to identify subtypes across the autism spectrum (1.L.B, 33%) and projects to discover biomarkers for ASD (1.L.A, 29%). A full list of objectives and their progress can be found in Appendix A. Eight percent of funding for Question 1 went to projects that were not specific to Question 1 objectives (Figure 4).
Two new objectives were added to Question 1 in 2011: one to determine the potential value of microarrays to use in genetic testing related to diagnosis (1.S.E) and another that called for a workshop to address the ethical, legal, and social implications (ELSI) of ASD research (1.S.F). While a few projects in the 2010 Portfolio Analysis related to the use of microarrays, an ELSI workshop was not held in 2010, so that objective was left incomplete in this analysis. However, an ELSI workshop was planned and held in 2011, and fulfillment of this objective will be reflected in the 2011 Portfolio Analysis. Other objectives in Question 1 that still need attention include studies to understand the impact of early diagnosis on choice of intervention and outcomes (1.S.D) as well as studies to identify reasons for health disparities in accessing early screening and diagnosis services (1.S.C).
Question 1: Diagnosis – Subcategories by Funding
(Total Funding: $45,622,080)
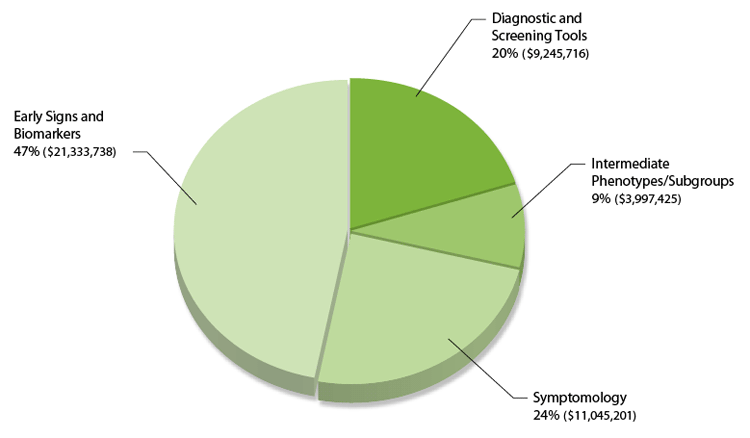
Figure 5. The four subcategories for research related to Question 1 (Diagnosis) illustrated a heavy focus on identifying Early signs and biomarkers for ASD. Characterizing Symptomology and developing Diagnostic and screening tools also received significant funding (24% and 20%, respectively). The smallest subcategory focused on identifying Intermediate phenotypes and subgroups of people with ASD (9%).
With the development of the subcategory categorization approach, projects that did not fit within research objectives are now classified, enabling better understanding of the research areas addressed by these projects. The research projects in Question 1 were divided into four subcategories: Diagnostic and screening tools, Early signs and biomarkers, Intermediate phenotypes/Subgroups, and Symptomology (Figure 5). Of the 166 projects in Question 1, 47% focused on looking for Early signs and biomarkers of ASD. These studies included eye tracking, infant and toddler development (often comparing children with ASD to their unaffected siblings or to typically developing children), and identifying differences in emotional or social interaction. The search for biomarkers of ASD encompassed both biological and behavioral markers of the disorder. Research evaluating and defining the Symptomology of ASD comprised 24% of the funding for Question 1 projects, and the development of new diagnostic, screening, and assessment tools accounted for 20% of Question 1 funding. The smallest subcategory of funding (9%) addressed defining Intermediate phenotypes and subgroups in individuals with ASD.
Question 2: Biology

Question 2 ("How Can I Understand What is Happening?") addresses the underlying biology of ASD and accounted for the most ASD research funding in 2010 (22%; $91 million). At least some progress was charted for each of the nine objectives in this question. Five of the objectives were partially fulfilled (yellow light in the stoplight figure to the right) while the other four objectives met the budget recommendations in their respective research areas (green light). Sixty percent of funding for Question 2 did not fit into a specific objective (Figure 4), and no new objectives were added to Question 2 in the 2011 Strategic Plan.
A significant portion of funding in this question (14%; $13 million) was devoted to understanding the underlying biology of genetic conditions related to ASD, including fragile X syndrome, Rett syndrome, and tuberous sclerosis complex (2.S.D). Projects that aimed to associate a specific genotype with a functional or structural phenotype, such as whether individuals with a specific gene variant tend to have increased social impairment compared to those who have other genotypes, received 10% ($9 million) of funding in Question 2 (2.S.G). These two objectives also received the largest portion of Question 2 funding in the 2009 Portfolio Analysis. Four of the objectives in Question 2 received 1% or less of the recommended amount of funding in 2010 (2.S.B, 2.S.C, 2.S.F, and 2.L.B); these same objectives also received very little funding in 2009.
While all objectives in Question 2 had some measurable research progress, the majority of research projects in this question did not fall under a particular objective. These projects were classified as "2 Other," and they accounted for 60% of the funding ($55 million) in Question 2 in the 2010 Portfolio Analysis. This was comparable to the 2009 Portfolio Analysis, when the funding for these "2 Other" projects corresponded to 54% of the total funding for Question 2. The large number of projects in this category may be related in part to the substantial amount of research on the underlying biology of ASD that was ongoing prior to the development of the IACC Strategic Plan. When the IACC developed the Strategic Plan, they intentionally focused the Plan's research objectives on gap areas,which left many well-funded areas of research unspecified in the list of objectives within the Strategic Plan.
Question 2: Biology – Subcategories by Funding
(Total Funding: $91,260,349)
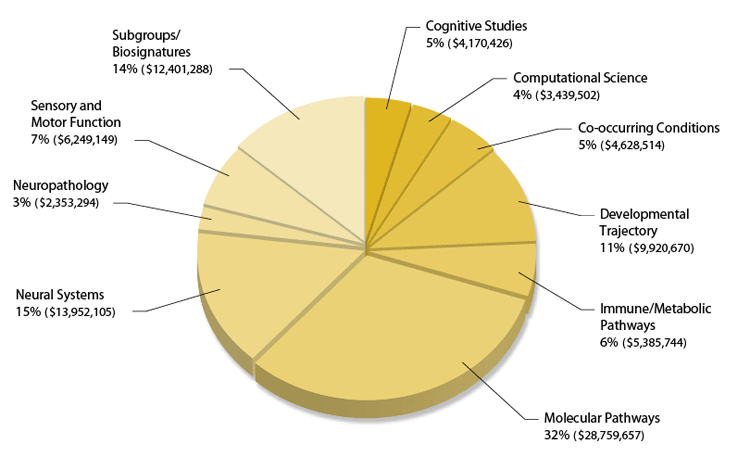
Figure 6. Question 2 encompassed a broad range of biological research, resulting in the need to create a larger number of subcategories to adequately describe the breadth of research than was required for other Strategic Plan Questions. The subcategory with the largest portion of funding was Molecular pathways (32%), followed by Neural systems and Subgroups/Biosignatures, which each received less than half the funding of Molecular pathways (15% and 14%, respectively). Projects related to Developmental trajectory were supported by 11% of 2010 ASD research funding, and research on Sensory and motor function received 7%. Studies on Immune/Metabolic pathways (6%), Co-occurring conditions (5%), Cognitive studies (5%), and Computational science (4%) round out the types of research in Question 2.
Question 2 contained more projects (409 projects; 30%) than any other question in the Strategic Plan and includes a broad range of biological research, from neural connectivity and imaging studies to sensory processing to cellular and animal models used to explore the molecular biology of ASD. Thus, this question was also divided into the largest number of subcategories assigned to any single question. These include: Cognitive studies, Computational science, Co-occurring conditions, Developmental trajectory, Immune/Metabolic pathways, Molecular pathways, Neural systems, Neuropathology, Sensory and motor function, and Subgroups/Biosignatures (Figure 6).
The largest portion of funding by far (32%; nearly $29 million) was devoted to research on Molecular pathways (systems of genes, proteins, and other molecules) involved in ASD and related disorders (such as fragile X, Rett syndrome, etc.), including projects that explore the function of these pathways using animal model systems that mimic various aspects of ASD. Research exploring the Neural systems involved in ASD, including brain structure and neural circuitry, as well as projects identifying ASD Subgroups and biosignatures, each accounted for about 15% of Question 2. These studies frequently employed imaging techniques such as fMRI (functional magnetic resonance imaging) to explore neural connections, often relating them to behavior or physical traits. Longitudinal studies that follow social, behavioral, and physical development over time comprised 11% of funding (Developmental trajectory subcategory), and research specific to Sensory and motor function corresponded to 7% of the funding. Research on the mechanisms of Immune and metabolic pathways accounted for 6% of ASD funding in 2010. Co-occurring conditions (including sleep disorders, epilepsy, and familial autoimmune disorders), Cognitive studies, and Computational science each accounted for about 5% of funding in Question 2. Cognitive studies include research on theory of mind, and computational methods and modeling allow the synthesis of complex data.
Question 3: Risk Factors

Question 3 ("What Caused This to Happen and Can It Be Prevented?") received 20% ($81 million) of the total funding for ASD research in 2010. Of the fifteen objectives in this question, six of them were partially fulfilled (yellow light in the stoplight figure to the right) and six reached the recommended funding level (green light). Nearly all projects in Question 3 were assigned to a particular objective, with only 2% of the funding distributed to projects that were not specific to the question objectives (Figure 4). The objective that received the largest proportion of funding in 2010 (42%, $34 million) focused on identifying genetic risk factors for ASD (3.L.B), followed by more than $16 million (21%) for the objective for genome-wide association studies to find candidate genes for autism (3.S.A).
Five Question 3 objectives were new to the 2010 analysis. These new objectives included research on epigenetics (3.S.J), investigating differences in the microbiome of individuals with ASD (3.S.I), developing model systems to explore environmental risks and their interaction with gender and genetic susceptibilities (3.S.K), studying special populations to understand environmental risk factors (3.S.H), and convening a workshop to assess the usefulness of bioinformatic approaches to identify environmental risks (3.S.G).
Three of the objectives in Question 3 received a red light, indicating no progress in 2010. One of these objectives seeks to develop measures for identifying markers of environmental exposure in biospecimens (3.S.B), and another strives to ensure that racially and ethnically diverse populations affected by ASD are enrolled in research studies (3.S.D). The other unfulfilled objective involves organizing a workshop to explore bioinformatic approaches to identify environmental risks (3.S.G). While this workshop was not convened in 2010 (and is considered red, or no progress in this report), a workshop on this topic was held in 2011 and completion of this objective will be reflected in the next Portfolio Analysis Report.
Question 3: Risk Factors – Subcategories by Funding
(Total Funding: $81,231,647)
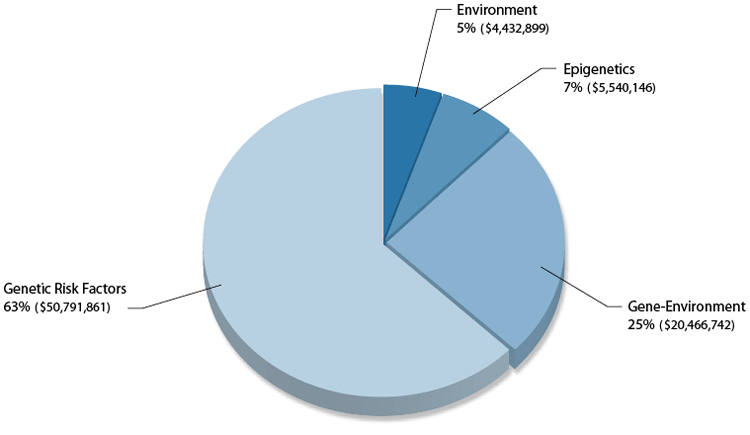
Figure 7. Genetic risk factors accounted for a majority of research funding in Question 3 in 2010 (63%). Gene-Environment studies received 25% of funding, Epigenetic studies 7%, and Environment studies 5%.
Projects in Question 3 were divided into four main subcategories: Environment, Epigenetics, Gene-Environment, and Genetic risk factors (Figure 7). Epigenetics is the study of heritable changes in gene function that occur without a change in the DNA sequence (such as methylation of DNA, which can influence whether genes are "turned on" or "turned off" in specific tissues during various points in development). These changes can be caused by environmental factors. Gene-Environment research investigates environmental risk factors in the presence of genetic susceptibility. Thus, these latter two subcategories include strong environmental components as well as genetic aspects. Genetic risk factors accounted for 63% of funding in 2010 based on the subcategory analysis. Projects that considered only environmental factors accounted for 5% of funding, while projects that examined Gene-Environment interactions accounted for 25%. Epigenetics received 7% of the ASD research funding in Question 3. Combined, all of the subcategories in Question 3 that may take environmental factors into account (Environment, Gene-Environment, and Epigenetics) represented 37% of the Question 3 funding landscape.
Question 4: Treatments and Interventions

Research addressing Question 4 ("Which Treatments and Interventions Will Help?") received 17% of 2010 ASD research funding ($68 million). Overall progress on the objectives in this question is illustrated in the stoplight figure to the right, with fulfillment of funding goals on five objectives (green light), partial fulfillment of six objectives (yellow light), and no progress on one objective (red light). Nine percent of the funding in Question 4 went to projects that were not specific to an objective within that question (Figure 4).
One objective in Question 4 progressed from yellow to green light status between 2009 and 2010. This objective calls for studies to evaluate the safety and effectiveness of medications commonly used to treat co-occurring conditions or specific behavioral issues in people with ASD (4.L.C). The Question 4 objective to develop model systems that replicate features of ASD received the highest proportion of funding in both 2009 and 2010 (4.S.B, 34% in 2010).
Of the twelve objectives in Question 4, three were new to this analysis. The new objectives ranged from studies on interventions for nonverbal individuals with autism (4.S.G) to research on preventing secondary conditions associated with autism (such as obesity, injury, and co-occurring psychiatric and medical conditions; 4.S.H) to studies that assess the effectiveness of interventions and services in broader community settings (4.L.D). Many projects assessing educational interventions used in classrooms and school settings fall into this latter objective because the Strategic Plan does not currently include any specific objectives related to the education of children with autism.
Among the new objectives, research studies on interventions for nonverbal individuals and on interventions in community settings were both well underway (green light). The only objective in Question 4 that had not yet received funding support calls for a workshop to advance the understanding of clinical subtypes and treatment personalization (red light; 4.S.E).
Question 4: Treatments and Interventions – Subcategories by Funding
(Total Funding: $68,123,890)
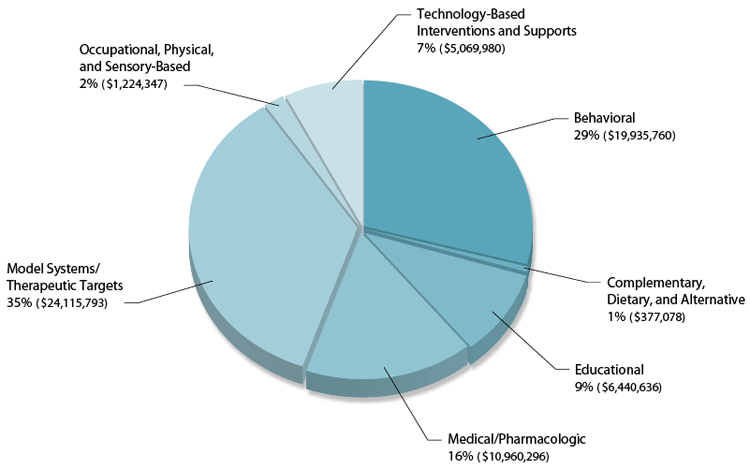
Figure 8. The subcategories for Question 4 illustrate the many approaches to treatments and interventions supported by autism research funders. The largest amount of funding supported projects to develop Model systems and therapeutic targets (35%), followed by research on Behavioral interventions (29%). Medical/Pharmacologic interventions received 16% of funding, classroom-based interventions (Educational) received 10% of funding, and Technology-based interventions and supports received 7% of funding. The subcategories with the smallest amounts of funding included Occupational, physical, and sensory-based (2%) and Complementary, dietary, and alternative (1%).
From medications to alleviate common and co-occurring symptoms of the disorder to behavioral therapies to improve communication and learning, Question 4 includes varied approaches to treatments and interventions. Subsequently, there are several subcategories to describe the research in this question: Behavioral; Complementary, Dietary, and Alternative; Educational; Medical/Pharmacologic; Model systems/Therapeutic targets; Occupational, physical, and sensory-based; and Technology-based interventions and supports (Figure 8). The largest amount of funding supported early phases of intervention development. Specifically, $24 million or 35% of projects in Question 4 represented efforts to develop Model systems and therapeutic targets, including animal models that exhibit behavioral characteristics similar to those observed in autism as well as cell lines used to test molecules as potential drug candidates. Research on Behavioral therapies (encompassing applied behavior analysis (ABA), the Lovaas method, cognitive behavioral therapy, social skills training, and joint attention training, among others) accounted for 29% of ASD research funding in Question 4, followed by research on Medical and pharmacologic interventions, which received 16% of the funding. Educational interventions, such as those used in a classroom setting, corresponded to 10% of research, and Technology-based interventions and supports, including augmentative and alternative communication (AAC) and robots to help children with ASD develop social skills, received 7% of the funding in Question 4. The subcategories with the smallest amounts of funding included Occupational, physical, and sensory-based therapies (2%) and Complementary, dietary, and alternative treatments (1%). These last two categories are more specialized therapeutic areas and include emerging approaches to treatments and interventions, so they were expected to be small, but distinct, areas of research.
Question 5: Services

The research in Question 5 ("Where Can I Turn for Services?") encompasses services and supports for people with ASD, addressing issues including access to services, dissemination of evidence-based practices, and training of providers (pediatricians, teachers, social workers, etc.). Of the nine objectives in this question, five are partially fulfilled (yellow light), three have reached or exceeded the recommended budget amount (green light), and one objective lacked measureable progress (red light). Projects in Question 5 were assigned to a specific objective 79% of the time, with 21% of the funding not specific to question objectives (Figure 4).
The amount of research funding in Question 5 increased dramatically between 2009 and 2010, from $8.6 million to $64.8 million. This change was mostly attributed to more comprehensive reporting by the Health Resources and Services Administration (HRSA), including their Leadership Education in Neurodevelopmental Disabilities (LEND) program, which supports fellowships to pediatricians to enhance the behavioral, psychosocial, and developmental aspects of general pediatric care, as well as their Developmental Behavioral Pediatrics Training Programs at multiple sites across the U.S. In addition, the Department of Education (ED) provided more comprehensive data for their autism-related portfolio, reporting significantly more projects in 2010, many of which involved training teachers in effective methods to engage students with ASD and other developmental disabilities.
The more comprehensive reporting by HRSA and ED were driving factors in improving the funding status for two objectives in 2010. One objective, which progressed from red to yellow, requires implementation and evaluation of coordination among State and local agencies to provide integrated and comprehensive community-based supports and services for individuals with ASD (5.S.C). The progress on this objective was led by HRSA's State ASD Demonstration projects. The objective that supports training to increase skill level in service providers progressed from yellow in 2009 to green in 2010, with the largest proportion of Question 5 funding (56%, $36 million) in the 2010 Portfolio Analysis.
Question 5 also had three new objectives to address in the 2010 analysis, including two involving health and safety issues for people with ASD (5.S.D and 5.L.D) and one examining dental health issues (5.L.E). As illustrated by the stoplight figure for this question, some progress is being made on all but one objective. The objective that lacked notable progress in 2010 calls for testing the efficacy and cost-effectiveness of evidence-based services and supports for people with ASD in community settings (5.L.B). Cost effectiveness research continues to be an area of needed growth in multiple disciplines of autism research.
Question 5: Services – Subcategories by Funding
(Total Funding: $64,849,122)
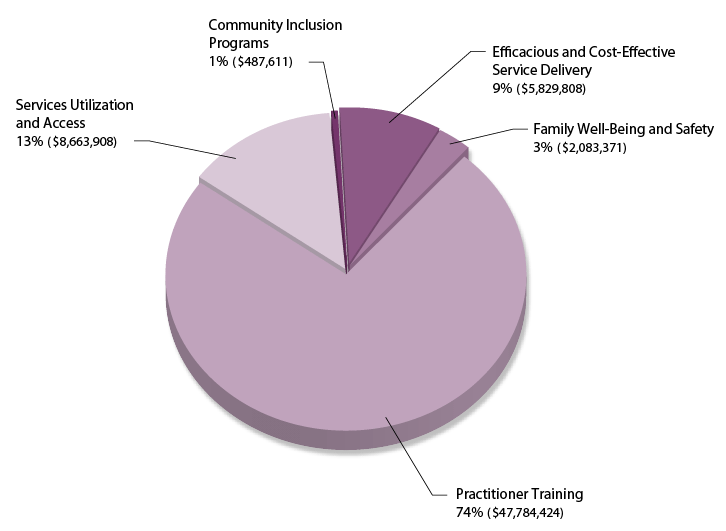
Figure 9. The Practitioner training subcategory in Question 5 dwarfed the other four categories, accounting for 74% of the funding for this question. Services utilization and access followed with 13% of the funding, and Efficacious and cost-effective service delivery accounted for 9%. Only 3% of funding was designated for projects related to Family well-being and safety, and even less (1%) for Community inclusion programs.
The subcategories describing the research in Question 5 reflect some of the variety in service needs: Community inclusion programs, Efficacious and cost-effective service delivery, Family well-being and safety, Practitioner training, and Services utilization and access (Figure 9). Because of the broader reporting of autism-related services research projects by HRSA and ED in 2010, the largest subcategory was Practitioner training (74%). Services access and utilization (including potential barriers to access) accounted for 13% of the funding in Question 5, followed by Efficacious and cost-effective service delivery with 9%. This latter subcategory included several parent training projects (to deliver a behavioral therapy, for example), often using a remote, web-based format that would make distributing the training programs cost-effective and accessible across the country. Family well-being and safety projects received only 3% of the funding in Question 5, and Community inclusion programs received just 1%.
Question 6: Lifespan Issues

Although Question 6 ("What Does the Future Hold, Particularly for Adults?") was the question in the 2010 Portfolio Analysis with the smallest proportion of funding at only 2% ($6.6 million), significant progress was made on this question when compared to 2009. In 2009, no progress had been made on five of the eight objectives, whereas in 2010, only one objective lacked any funding (red light). This objective (6.L.D) calls for research to test the results of comparative effectiveness research implemented in real-world settings that will improve health outcomes and quality of life for adults with ASD. Because comparative effectiveness research in the area of lifespan issues is quite limited, evaluating the implementation of this research may take a few years. On the other hand, the objective that seeks to determine how interventions, services, and supports delivered during childhood impact adult health and quality of life outcomes (6.L.B) advanced from receiving part of the recommended funding in 2009 to receiving the full funding amount in 2010 (green in the stoplight figure). Ten percent of the funding for Question 6 supported research projects that were not related to the objectives in the Strategic Plan (Figure 4), and no new objectives were added to this question in 2011.
Because Question 6 only contained 34 projects, overlapping content made it difficult to generate distinct subcategories for the research. This question addresses issues across the ASD lifespan, including the transition into adulthood and adult services. This often incorporates training to help adolescents move from the education system to finding employment, and vocational training and job skills are key aspects of projects in Question 6. Social skills training to help people with ASD interact successfully with others in the workplace and in the community was also a common feature among projects. Many of the projects integrated training and services related to all of the above areas, which hampered efforts to separate them into distinct subcategories. Beyond those service areas, one project in Question 6 addressed adult diagnosis, and notably, a few studies involving treatments for adults were categorized within Question 4 (Treatments and Interventions) of the Strategic Plan. Although the current research on the lifespan of people with ASD is too narrow to divide into subcategories, this will likely change as the research field grows, and subcategories that encapsulate the scope of projects in this question may be defined in the future.
Question 7: Infrastructure and Surveillance

The research in Question 7 ("What Other Infrastructure and Surveillance Needs Must Be Met?") covers the most diverse range of any other question in the Strategic Plan and has the largest number of objectives. Six objectives had the recommended amount of funding (green light), six were partially fulfilled (yellow light), and four were not yet funded (red light). This question received 12% ($50.8 million) of ASD research funding in 2010, with three new objectives to address issues of research infrastructure. One of the new objectives seeks to enable clinical research sites to collect and coordinate comprehensive diagnostic, biological, medical, and treatment history data that would provide a platform for conducting comparative effectiveness research and clinical trials of novel autism treatments (7.N). The second new objective aims to create an information resource for autism researchers to facilitate data sharing and standardization of methods across projects, including common protocols and analytic techniques (7.O). The third new objective supports establishing facilities to develop and expand the availability and utility of animal models related to autism, along with high-throughput screening technology to evaluate the model systems (7.P).
At least some progress is being made on all of the new objectives, with two of them meeting the recommended budget amount (7.N and 7.P) and one partially meeting the goal (7.O). Four of the objectives in Question 7 did not receive any funding in 2009 or 2010. These objectives included establishing funding mechanisms for the rapid replication of research findings (7.F), developing databases to track the involvement of people with ASD in healthcare, education, and social services (7.A), "Promising Practices" papers describing innovative and successful services and supports (7.M), and developing a web-based tool that can provide current State-by-State ASD prevalence estimates (7.G). The two objectives that received the largest proportion of Question 7 funding in 2010 related to supporting biobanks with samples from individuals with autism to be used in research (7.D, 15%) and expanding the research workforce (7.K, 14%). In addition, 26% of the funding for projects in Question 7 was generally related to research involving infrastructure or surveillance, but not specific to an objective within that question (Figure 4).
Question 7: Infrastructure and Surveillance – Subcategories by Funding
(Total Funding: $50,847,064)
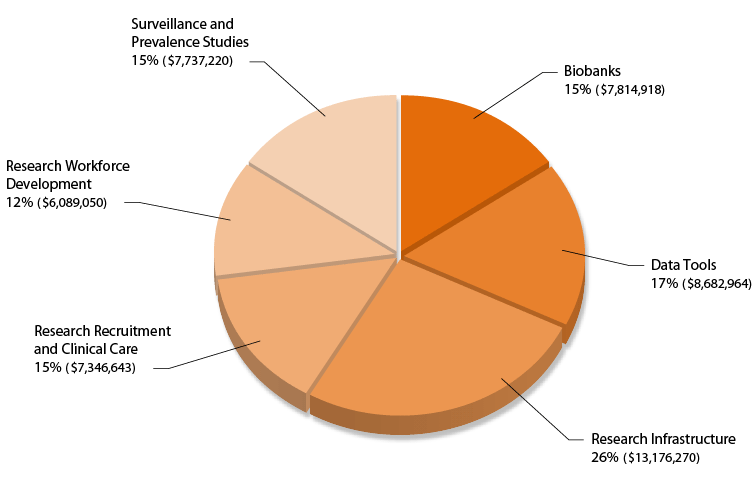
Figure 10. The subcategories in Question 7 cover a broad range of research areas, and funding was largely evenly distributed. Research infrastructure received 26% of the funding in Question 7, followed by Data tools with 17%. Biobanks and Surveillance and prevalence studies each received 15% of funding, Research recruitment and clinical care received 14% of funding, and Research workforce development received 12%.
The subcategories in Question 7 reflect the diverse array of projects covered by the objectives: Biobanks, Data tools, Research infrastructure, Research recruitment and clinical care, Research workforce development, and Surveillance and prevalence studies (Figure 10). Funding for the Research infrastructure subcategory was highest among the topic areas, with 26% of the funding share for Question 7. Data tools, such as the National Database for Autism Research (NDAR) and the Autism Genetics Resource Exchange (AGRE), comprised 17% of the research funding. Biobanks that collect DNA and tissue samples from autism patients received 15% of the research support, as did Surveillance and prevalence studies. The support in the latter subcategory was largely devoted to the Autism and Developmental Disabilities Monitoring (ADDM) Network, coordinated by the Centers for Disease Control and Prevention (CDC), which estimates autism prevalence in different areas of the United States. A few of the projects in this subcategory also examined autism prevalence internationally. Research recruitment and clinical care projects, which help increase participation in research studies and conduct medical evaluations for the participants, received 14% of funding in this question, and Research workforce development, which supports many conferences and training for autism researchers, received 12% of the funding for Question 7.


